Trim excess white borders on generated graphs
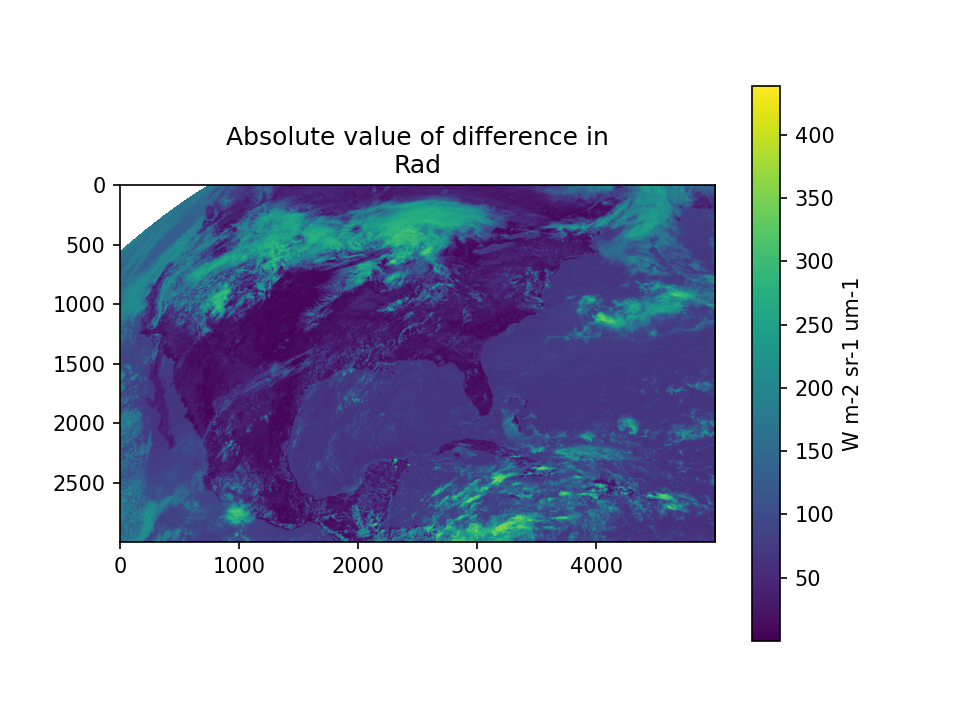
Generated graphs have lots of whitespace around them because matplotlib loves whitespace. However, I'm less of a fan of lots of whitespace, especially when I'm trying to pack a bunch of charts into a small space to easily skim them. For example:
Less margin would be better. Perhaps something like:
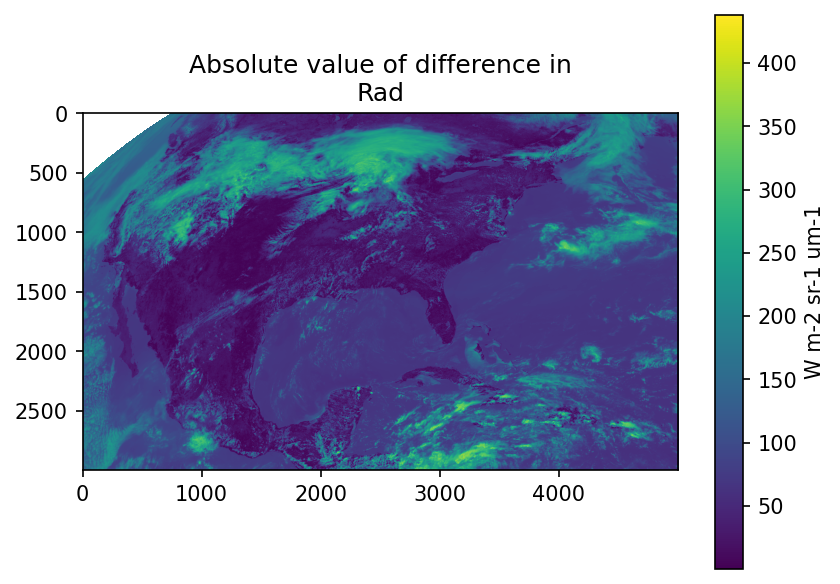
One possible solution is to use matplotlib.pyplot.savefig's bbox_inches and optionally pad_inches. Setting bbox_inches='tight' will cause matplotlib to remove as much border as possible, then re-add pad_inches (which defaults to 0.1). This is what generated the second image above. You can trim even tighter, all the way down to pad_inches=0, although that gets very cramped feeling when looking at the image by itself.
So in pyglance/glance/plot.py in _handle_fig_creation_task around line 60, you could change
figure_obj.savefig(os.path.join(outputPath, fullFigName), dpi=fullDPI)to
figure_obj.savefig(os.path.join(outputPath, fullFigName), dpi=fullDPI, bbox_inches='tight', pad_inches=0.1)There are other calls to savefig in Glance; I don't know if they should have similar arguments applied.
One potential down side: the resulting images will not have a consistent size! Long labels on the left side, the presence or absence of a color bar on the right, multiple lines of title, and other things can change the size of the "core" chart. So if consistent sizes are important... this might be a problem.